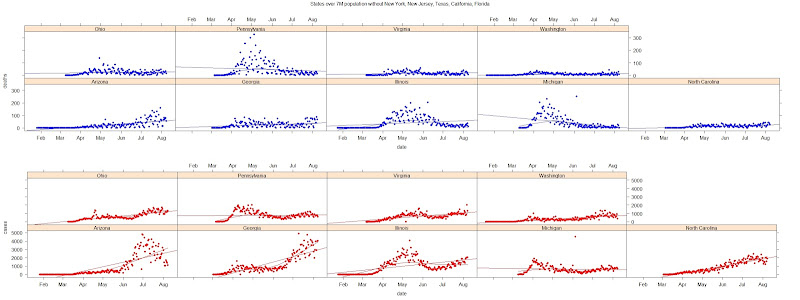
Covid-19 deaths march on in the United States. These are the cases and deaths from states with over 7 million in population as of August 9, 2020. Data accessed with NCoVUtils @ https://github.com/epiforecasts/NCoVUtils . Click to enlarge the charts! Note that some retroactive one days totals for cases and deaths are unmitigated outliers.
state population deaths dp100K dp1M
1: New Jersey 8882190 15941 179.47 1794.72
2: New York 19453561 32447 166.79 1667.92
3: Massachusetts 6892503 8762 127.12 1271.24
4: Connecticut 3565287 4441 124.56 1245.62
5: Rhode Island 1059361 1014 95.72 957.18
6: Louisiana 4648794 4207 90.50 904.97
7: District of Columbia 705749 590 83.60 835.99
8: Michigan 9986857 6527 65.36 653.56
9: Mississippi 2976149 1874 62.97 629.67
10: Illinois 12671821 7846 61.92 619.17
11: Delaware 973764 590 60.59 605.90
12: Maryland 6045680 3577 59.17 591.66
13: Pennsylvania 12801989 7372 57.58 575.85
14: Arizona 7278717 4140 56.88 568.78
15: Indiana 6732219 3036 45.10 450.97
16: South Carolina 5148714 2007 38.98 389.81
17: Georgia 10617423 4095 38.57 385.69
18: Florida 21477737 8108 37.75 377.51
19: Alabama 4903185 1764 35.98 359.77
20: New Mexico 2096829 681 32.48 324.78
21: Colorado 5758736 1866 32.40 324.03
22: Ohio 11689100 3668 31.38 313.80
23: New Hampshire 1359711 419 30.82 308.15
24: Nevada 3080156 949 30.81 308.10
25: Texas 28995881 8879 30.62 306.22
26: Minnesota 5639632 1689 29.95 299.49
27: Iowa 3155070 926 29.35 293.50
28: Virginia 8535519 2340 27.41 274.15
29: California 39512223 10299 26.07 260.65
30: Washington 7614893 1758 23.09 230.86
31: Missouri 6137428 1381 22.50 225.01
32: North Carolina 10488084 2184 20.82 208.24
33: Nebraska 1934408 357 18.46 184.55
34: Kentucky 4467673 793 17.75 177.50
35: Arkansas 3017804 535 17.73 177.28
36: Tennessee 6829174 1202 17.60 176.01
37: Wisconsin 5822434 1008 17.31 173.12
38: South Dakota 884659 145 16.39 163.90
39: Oklahoma 3956971 604 15.26 152.64
40: North Dakota 762062 116 15.22 152.22
41: Idaho 1787065 237 13.26 132.62
42: Kansas 2913314 380 13.04 130.44
43: Utah 3205958 337 10.51 105.12
44: Maine 1344212 126 9.37 93.74
45: Vermont 623989 58 9.30 92.95
46: Puerto Rico 3193694 293 9.17 91.74
47: Oregon 4217737 360 8.54 85.35
48: West Virginia 1792147 131 7.31 73.10
49: Montana 1068778 75 7.02 70.17
50: Wyoming 578759 28 4.84 48.38
51: Alaska 731545 24 3.28 32.81
52: Hawaii 1415872 30 2.12 21.19
state population deaths dp100K dp1M


No comments:
Post a Comment
Moderated Comments: Be polite and quantitative in your remarks. Just because I am not always so doesn't mean you will get your commentary published.